Data security will always be a relevant topic, regardless of how advanced you are in your Power Apps development. Security levels in Power Apps will vary from whether or not you have access to the app to row- and field-level security based on your Azure AD. But regardless, the underlying data source must either be shared or implicitly shared with the user, in order for the application to work.
This poses a problem, since shared and implicitly shared connections can be used to access the data outside of the application, i.e. the data sources can be read and altered in other ways than the application intended. Your company’s IT department might not be too happy about granting everyone read- and write access to the SQL Server data warehouse so you can test your budgeting application.
Does this mean that you must choose to either give full access to everyone in your organization, or limit Power Apps to only the few privileged who can be trusted with all the data?
Fortunately no. By connecting the application to SQL Server Stored Procedures that create, read, update or delete records from you SQL tables, you can limit the users to only do what the application was intended for.
This post will detail how you can achieve this, with a monthly result commenting example.
NOTE: Running stored procedures, as well as many other SQL-related tasks in Power Automate, requires a Premium Account. You can run a free trial if you want to test out the solution before committing.
The Scenario
Your application users will be able to read the result for a cost center with data coming from both a Budget and an Actuals table. They will then be able to create new rows in a Comments table. The tables reside in SQL Server.
The end user will see the results for the cost centers, and be able to post a comment regarding the variance.
It would be risky to give the cost center owners access to the accounting and budget tables, so we want to restrict their access to the actions intended by the application.
The setup
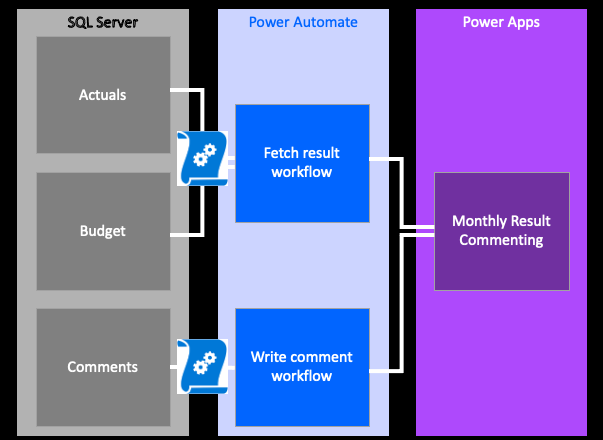
Our application will have three tables, and will fetch and write to the underlying data tables through running Stored Procedures with Power Automate.
The Fetch Result workflow will combine the budget and actual tables, delegating some of the calculations to SQL Server through the stored procedure. The output will then be stored as a Collection in the app.
The Write Comment workflow will look at an input box within the application, and submit this (together with some meta data) as a new row into the Comments table.
The tables look as follows:
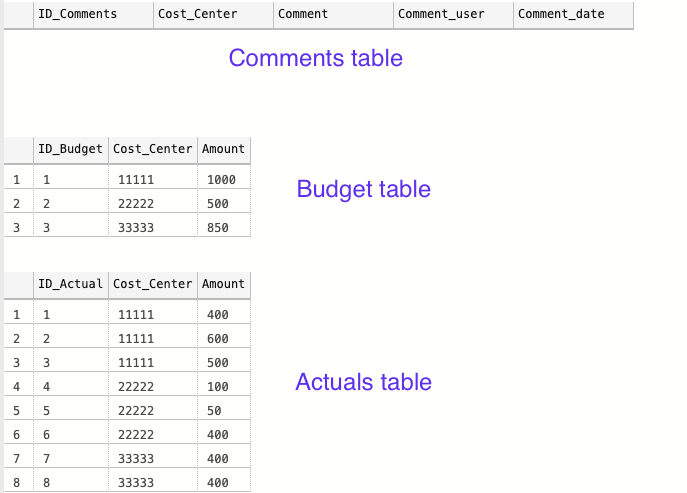
The Comments table is currently empty, and the Actuals and Budget tables have some values that will give some kind of variance to comment on.
Setting up the application
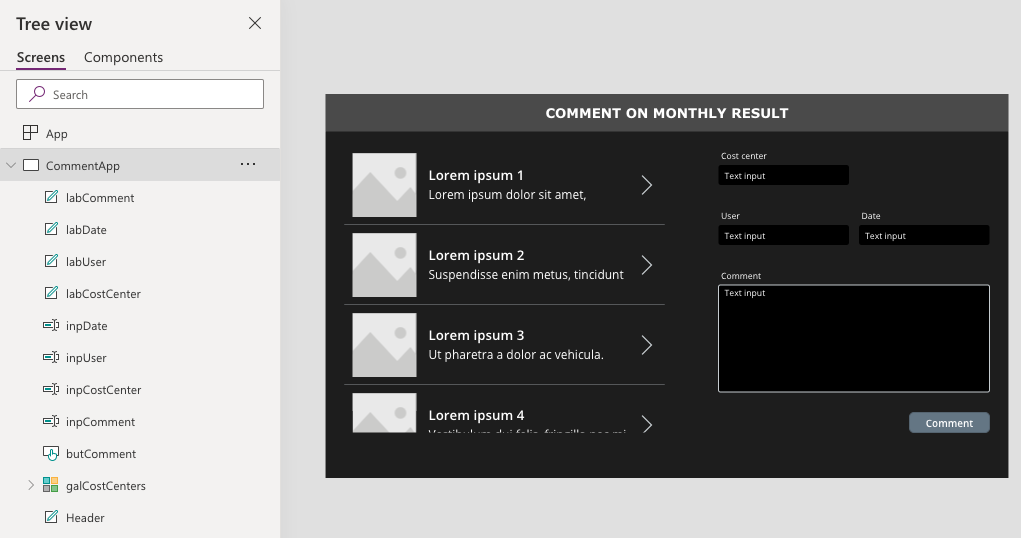
The application that I’m building for the example will have the user choose a cost center and then comment on it. For simplicity, it will not show previous comments or any other functionality – only create a new row in the comments section.
The Cost Center, User, and Date input boxes will be filled based on the Gallery Selection, logged in user, and today’s date, respectively. So the user will only have to fill in the comment section, and click the Comment-button.
Writing the Stored Procedures
Let’s start with fetching the data. I’m thinking that a good set-up could be to let SQL join the Actual and Budget tables into one, and calculate the variance for us, and then send a summarized table to the Power App. As the example business grows, a single cost or revenue center could have plenty of transactions, and it’s better to delegate the calculations to SQL Server.
So the output that we want should look like:
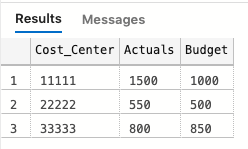
The data that we have in the Actuals table has several records, while the Budget table seems aggregated, meaning that we will have to create a temporary table that summarize the Actuals-amounts on Cost centers, and then join the two tables. Here’s the code:
-- SQL example code --
-- Create a temporary table to store the summarized transactions in
CREATE TABLE temp
  (
     cost_center CHAR(5),
     actuals     INT
  )

-- Populate the temporary table with the summarized actuals per cost center
INSERT INTO temp
SELECT cost_center,
       Sum(amount) AS 'Actuals'
FROM   dbo.actuals
GROUP  BY cost_center

-- Join the temporary table with the Budget table on Cost Center
SELECT a.cost_center  AS 'Cost_Center',
       Sum(a.actuals) AS 'Actuals',
       Sum(b.amount)  AS 'Budget'
FROM   dbo.temp AS a
       LEFT JOIN dbo.budget AS b
              ON a.cost_center = b.cost_center
GROUP  BY a.cost_center

-- Remove the temporary table
DROP TABLE dbo.temp
Now, we want to create a Stored Procedure out of this. A Stored Procedure is some SQL code that you save in your database, that can be called upon to be executed. It can have various results. If the SQL code is an Insert Into type of query, the result is a new row, and if the code is a Select-statement, the output would be a table with the defined rows and columns.
Power Apps cannot itself call upon a Stored Procedure, but Power Automate can. Hence, we can trigger a workflow in Power Automate with a Power Apps button, and execute the Stored Procedure as defined.
Once you have your SQL code (I have mine posted above), it’s easy to create a Stored Procedure. Just add
CREATE PROCEDURE procedure_name
AS
sql_statement
to your query. As illustrated in the first picture, I will need two stored procedures, one for fetching the data and one for adding the comments. So with the Fetch Results example above, you would add as follows:
CREATE PROCEDURE fetch_results

AS

-- Create a temporary table to store the summarized
CREATE TABLE temp
  ... (see full statement above)
For the procedure where we want to insert values into a new row in the comments table, we first need to define the parameters (which we will ultimately will extract from the Power App) and then make a Insert Into query that makes good use of those parameters.
The SQL code will look something like:
-- Create the stored procedure to write comments in Comments table
CREATE PROCEDURE Write_comment
  -- Define the needed paramenters to insert
  @inp_Cost_Center  CHAR(5),
  @inp_Comment      CHAR(200),
  @inp_Comment_user CHAR(100),
  @inp_Comment_date DATE
AS
    -- Code to insert the selected parameters into respective column
    INSERT INTO dbo.comments
                (cost_center,
                 comment,
                 comment_user,
                 comment_date)
    VALUES     (@inp_Cost_Center,
                @inp_Comment,
                @inp_Comment_user,
                @inp_Comment_date)
After running those queries, the two Stored Procedures has been saved to our database, and we can call upon them by writing
-- Run procedure to get results data
EXEC fetch_result

-- Run procedure to insert new comments
EXEC write_comments
   @inp_cost_center = '11111',
   @inp_comment = 'Example comment here, up to 200 chars',
   @inp_comment_user = 'Karl-Johan',
   @inp_comment_date = GetDate()
Next we have to create a Power Automate workflow that we can trigger from the app that executes the Stored Procedures as we want them.
Creating the Power Automate workflow
This section is greatly indebted to Brian Dang’s post and video on using Power Apps as a front end for writing SQL code. I warmly recommend looking at the link for a more detailed walkthrough of running stored procedures with Power Automate and fetching its results.
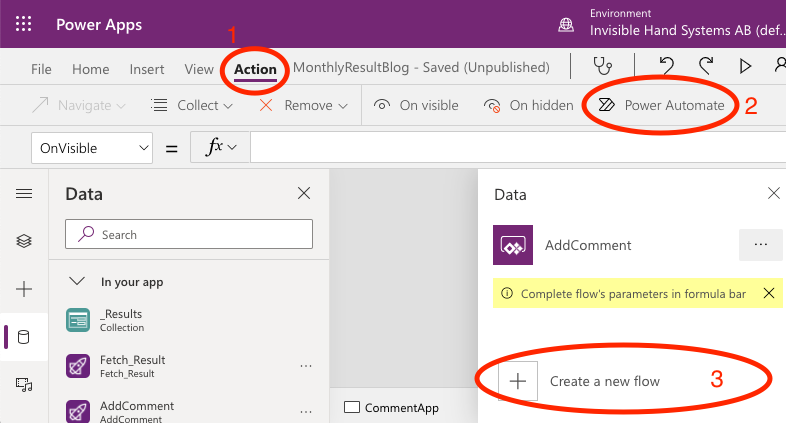
You can start creating your Flow from within Power Apps or from the Power Automate website, depending on your preference. In Power Apps, you find it in the Action ribbon, to the far right as Power Automate.
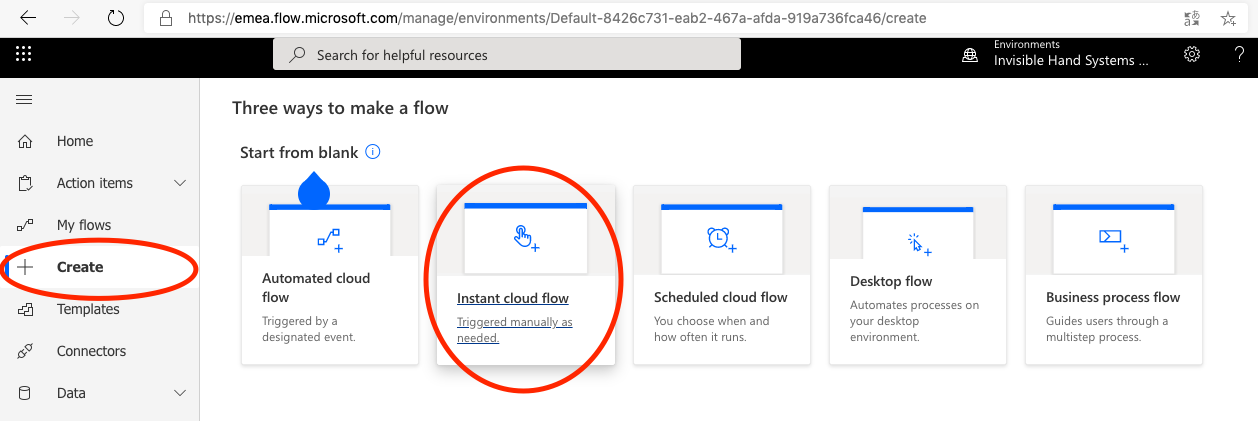
Second, we want to create a blank flow, that is triggered by Power Apps (it can either be triggered by a button or something like OnVisible).
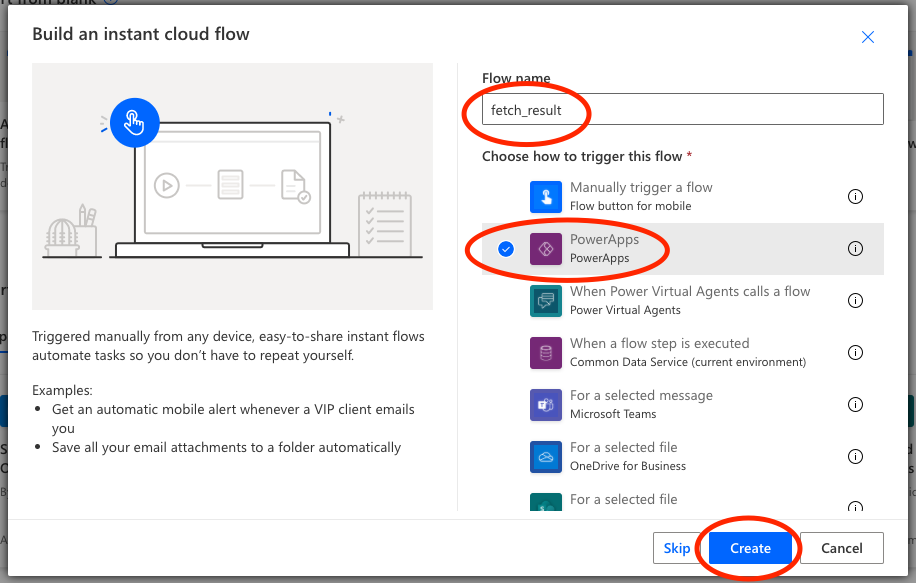
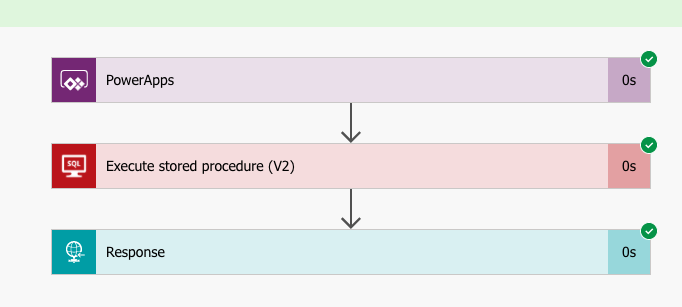
If you have choosen the Power Apps trigger, you will get that as an initial step in your Flow. Our flow will consist of three steps: the Power Apps trigger, a step called Execute a Stored Procedure (V2), and finally a step called Response that sends the output from the Stored Procedure back to the Power App.
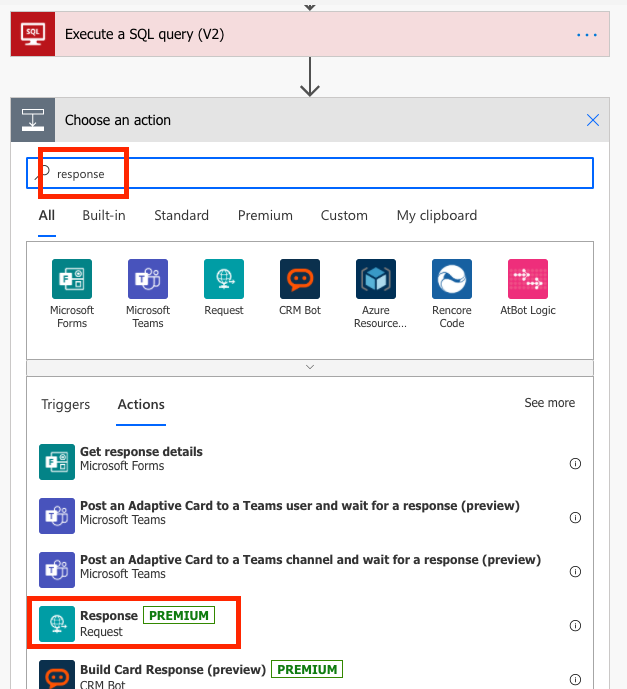
Start by adding the steps: you find them by searching for SQL and Response respectively:
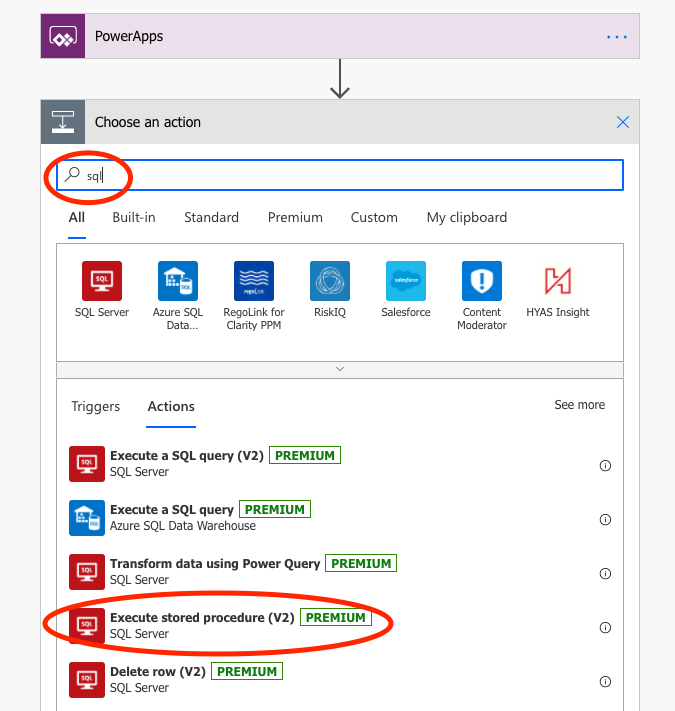
Let’s start with configuring the Execute Stored Procedure (V2) step. You choose the applicable settings for the database where you ran your Create Procedure script. I didn’t find my database at first, but you can switch connection in the three dots in the top right hand corner of the action. Then choose the database and the Stored Procedure that you have created. All is fine and dandy!
Second, let’s configure the Response step. This is a bit more technical, and if you get stuck, check out Brian Dang’s video for further clarification.
The Response action creates an output from the flow based on a JSON-script. But you need to help it along a little bit to tell it how it should interpret the script.
Once you have added the step, start by saving the Flow, and then run Test in the upper right hand corner of the screen (next to the Save-button). Then choose to trigger the Flow manually, and then Save & Test.
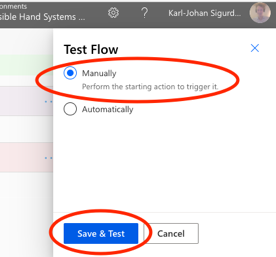
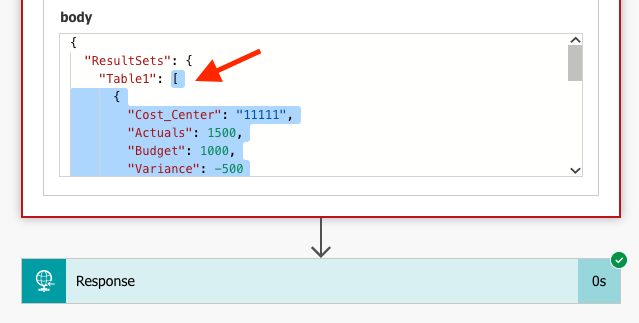
The Test-procedure will check your connections and such, and if all looks well there, you get to Run Flow. It should go smoothly, so when you click Done, you should end up with something a little bit like:
Click on the Execute Stored Procedure (V2) step, to expand the output. If you scroll down a bit, you get to see the Body output. Copy the text within the outer bracket [, i.e. exclude the first ResultSets and Table1. Make sure not to copy the closing curly brackets } in the end of the text relating to ResultSets and Table1.
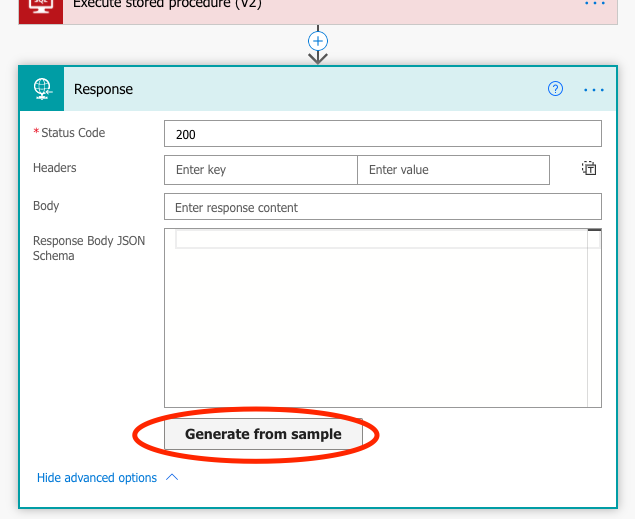
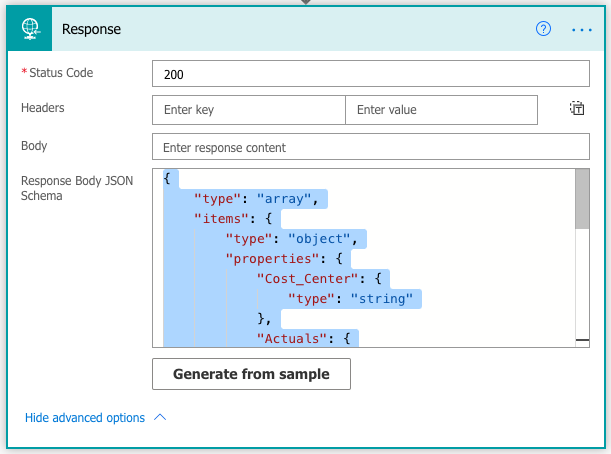
Go back to Edit mode of the flow. Open up the Advanced Options in the Response action, and click Generate from Sample.
Paste the sample text from the Test-output that we copied earlier, and click Done. You will get an autogenerated Response body schema.
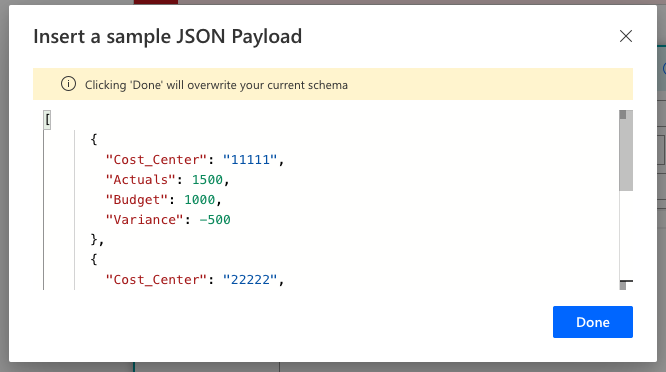
You can have a look through the code to see that it makes sense, for example that the column types are correct.
That sets the skeleton for the output. Now we need to tell the Response function how we’d like this data to be presented to our Power App. This is done in the Body-section of the Response action. Put the cursor in the Body-section, open up the Expression section, and enter the code below. Then click Save or Update, and you are good to go!
body('Execute_stored_procedure_(v2)').ResultSets.Table1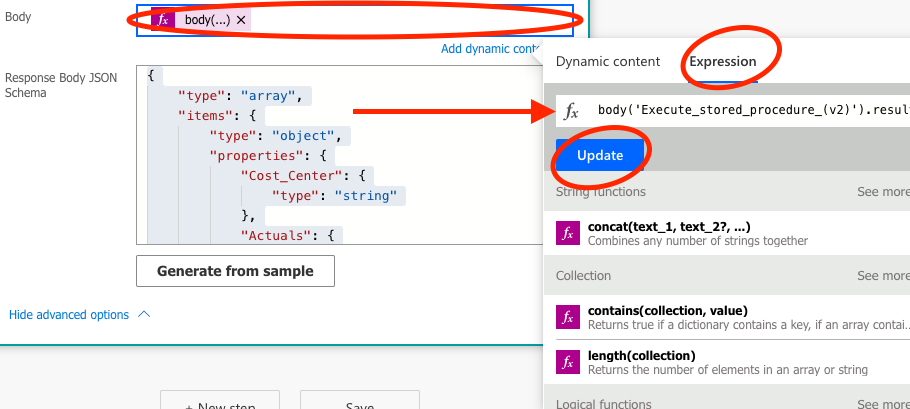
The second flow is simpler, as it only contains two steps: the trigger and the Execute Stored Procedure V2-action. You may of course want to expand on this in a real application, but in the example, simply entering the data into the Comments table will be sufficient.
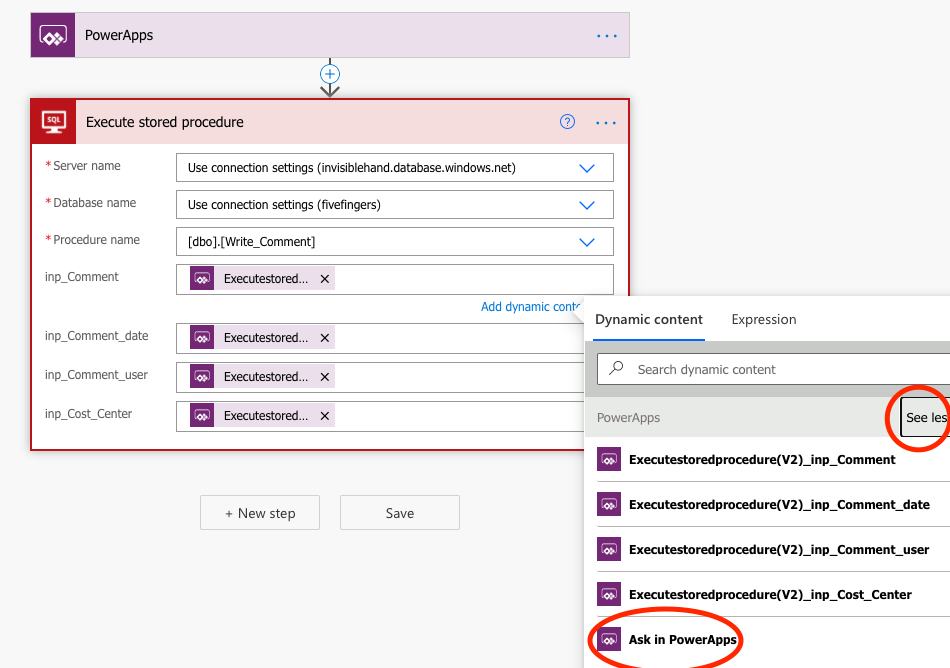
So precisely as in the steps described before, set up the Execute Stored Procedure V2-action, with the Write_Comments procedure.
Just one additional thing. Remember how we defined a bunch of parameters in the SQL query. Here, we have the opportunity to tell Power Automate where to fetch information for those parameters. For all of them, we want to ask in Power Apps what the information should be.
To do that, you put the cursor in respective field, and click on See more under Dynamic Content, and select Ask in Power Apps. Do this for each parameter.
Save, test, and done! Easy peasy.
Now the components are in place for the application. So let’s have a look at how we can connect the Flow to the application.
Connecting the Power Automate Flow and making your application work
Let’s assemble the parts we have created in our app. Firstly, we need to do something with the data that we create in the fetch_results stored procedure. In order to work with it, let’s load it in a Collection when the application starts.
Select the App in the Tree View, and then select the OnStart property. Here, you can tell the application what to do as it starts, and you can simulate starting the app by clicking on the three dots next to App in the Tree View and click Run OnStart.
To create a Collection upon launching the app, use the ClearCollect function. I’m calling my collection _Results, and I’m loading it with the table that is the output from the Fetch_Result Flow. Hence, the code is:
OnStart = ClearCollect(_Results, Fetch_Result.Run())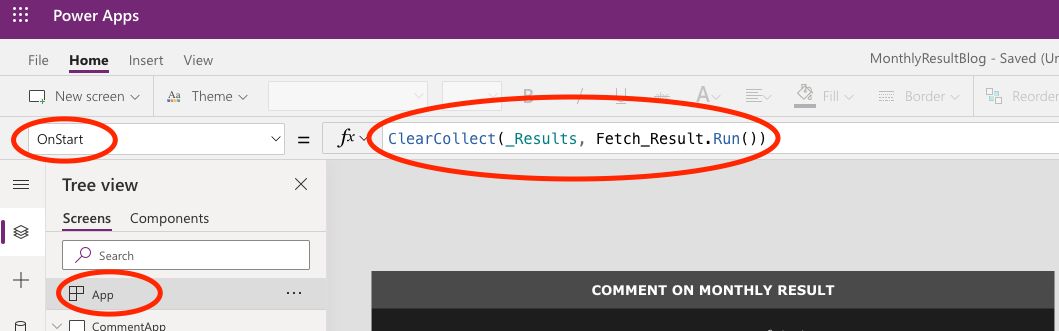
As the output from Fetch_Result is a ready table, and the Flow does not require any parameters, we don’t need to do anything else. The data will load, and we can use _Results as the Item-property in the gallery we created.
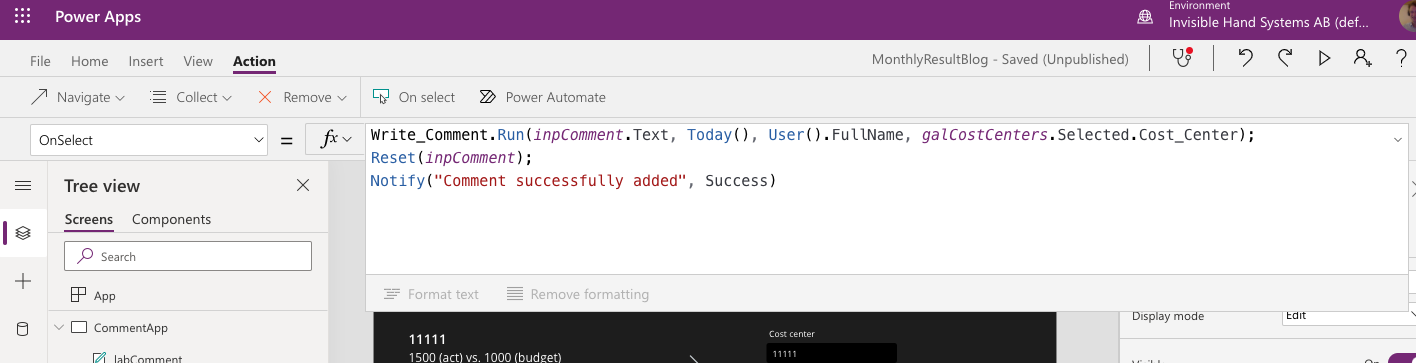
The Write_Comments Flow requires some more input. We need to tell it where to find the information it will enter in the various columns. The names might be a bit bulky, but you should be able to make out which parameter is which. In the example, the code for the OnSelect property of the button I added is:
OnSelect=
Write_Comment.Run(
    inpComment.Text,
    Today(),
    User().FullName,
    galCostCenters.Selected.Cost_Center
)
So I take the comment from the inpComment input box, the date is the current date (the output from the Today()-function), the commenting user fetches the full name from the currently logged in M365 user, and the cost center comes from the selected cost center in the gallery.
The user can now see the condensed results in the gallery, and create records in the Comments table, just as we wanted them to be able to.
There are several directions into which we could improve the example app. We could add row-level security, so that the users only could comment on their cost centers, by passing a user group parameter and filter the results table on that parameter. Or we could fetch and show the latest comments in the comments table, and maybe edit them directly. The SQL Stored Procedure methodology supports (maybe even simplifies) this type of development. And the data stored in the app is fit for purpose, and the data source is better protected at the same time.
Further reading
- On Stored Procedures: https://www.w3schools.com/sql/sql_stored_procedures.asp
- Brian Dang’s video on using Power Apps as a SQL front end: https://www.youtube.com/watch?v=MoifwDFKSTo
- Brian Dang’s blog post on using Power Apps as a SQL front end: https://powerapps.microsoft.com/en-us/blog/return-an-array-from-flow-to-powerapps-response-method/
- Some information on Power Platform Premium features: https://docs.microsoft.com/en-us/power-platform/admin/pricing-billing-skus
- Pragmatic Works’ video on passing arrays to and from Power Apps: https://www.youtube.com/watch?v=hTraYHbcIHc