Saw this interesting tweet a few days ago. I think it beautifully distills how software development is changing. Both the content and the origin of the retweet tells a story about were the world is heading.
API’s and cloud platforms have been around for a while, but it has taken time for the potential to catch on more widely among business managers outside tech.
The high quality and easy-to-use API’s now available with most modern solutions gives unprecedented possibility of tying information and processes together with ease. In turn, this creates a possibility to easily build meaningful applications that run on top of a cloud platform. The constantly increasing possibilites in Microsoft Power Apps is an obvious example. New connectors are made available frequently and in addition you can create your own custom connection to a REST API.
Even though we believe data and data models should be managed in robust cloud based environments using Power BI and Power Apps, we all come across times when a specific data task needs to be handled quickly. For many of us Excel will then be the tool we turn to.
Unfortunatly many still view and use the tool based on its traditional features and many of the newer and more powerful features are overlooked. E.g. Power Query and Power Pivot.
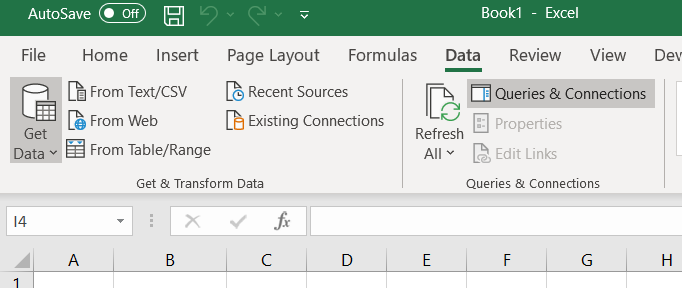
In the ‘Get & Transform Data’ group under the ‘Data’ tab you will find the same Power Query tools as in Power BI desktop, providing a nice familiarity between the two tools.
However, as you might know, Excel’s basic spreadsheet size is limited to 1,048,576 rows. Most times, this is probably enough, but increasingly often we need to work with larger datasets, even for ad-hoc work. Of course, we could adjust our SQL query to reduce the number of rows. But if we are still exploring the data it can be really useful to utilise great Excel features like pivot tables.
Enter Power Pivot. This is the feature that allows you to work with millions of rows of data in Excel. It has the same infrastructure (Vertipaq) and design as the Table and Model views in Power BI desktop and allows for creating measures and calculated columns/tables with DAX just as in Power BI. (Unfortunatly the design interface is a little bit older and lacks things like IntelliSense when designing DAX formulas.)
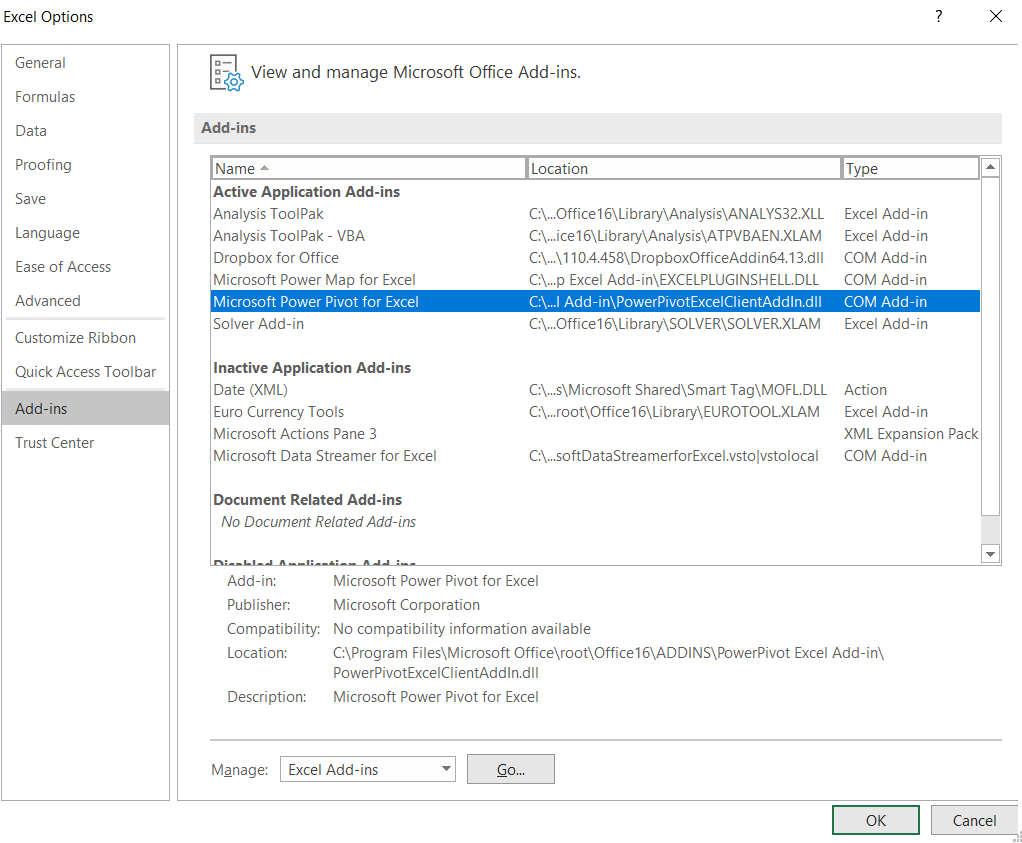
To start using Power Pivot, first ensure it’s enabled in under Excel Options:
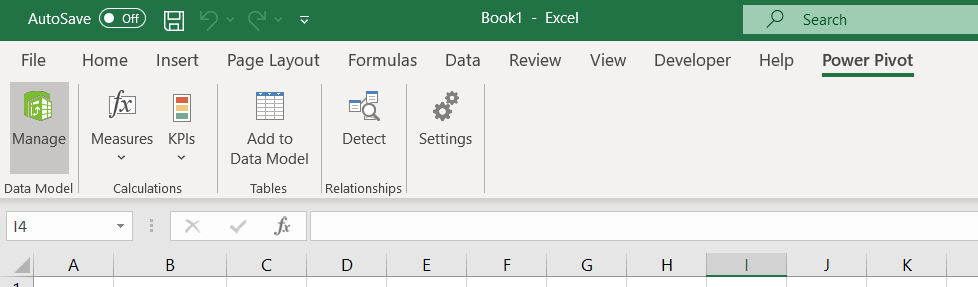
It will then be available under its own tab in Excel called ‘Power Pivot’
From here you can add tables already in the excel file to the Power Pivot data model, but then we would be limited to just above 1 million rows per table.
The trick is to load the external data directly to the Power Pivot data model, without loading it into an excel table.
There are two ways to do this, either from inside Power Pivot or by using Power Query.
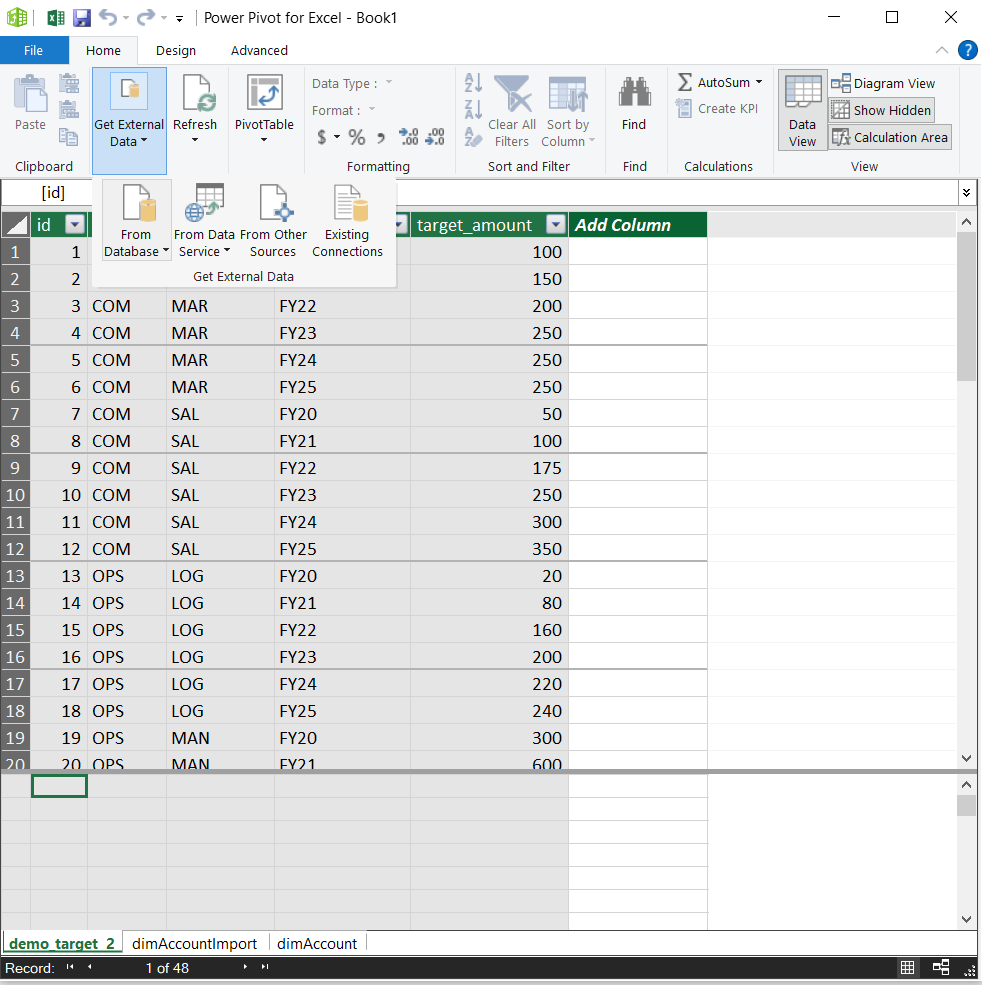
To load the data through Power Pivot, press ‘Manage’. From the new window that pops up it is easy to find the buttons needed to retrieve data from a database
Recognise the Table and Model buttons at the bottom right from somewhere else?
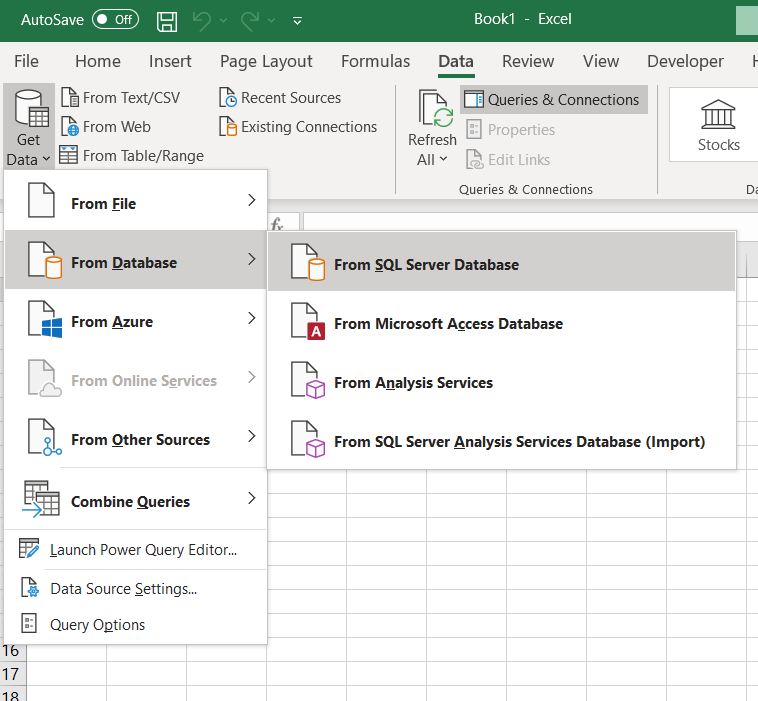
Alternatively you could achieve the same result by using Power Query. First, go to ‘Get Data’ in Excel:
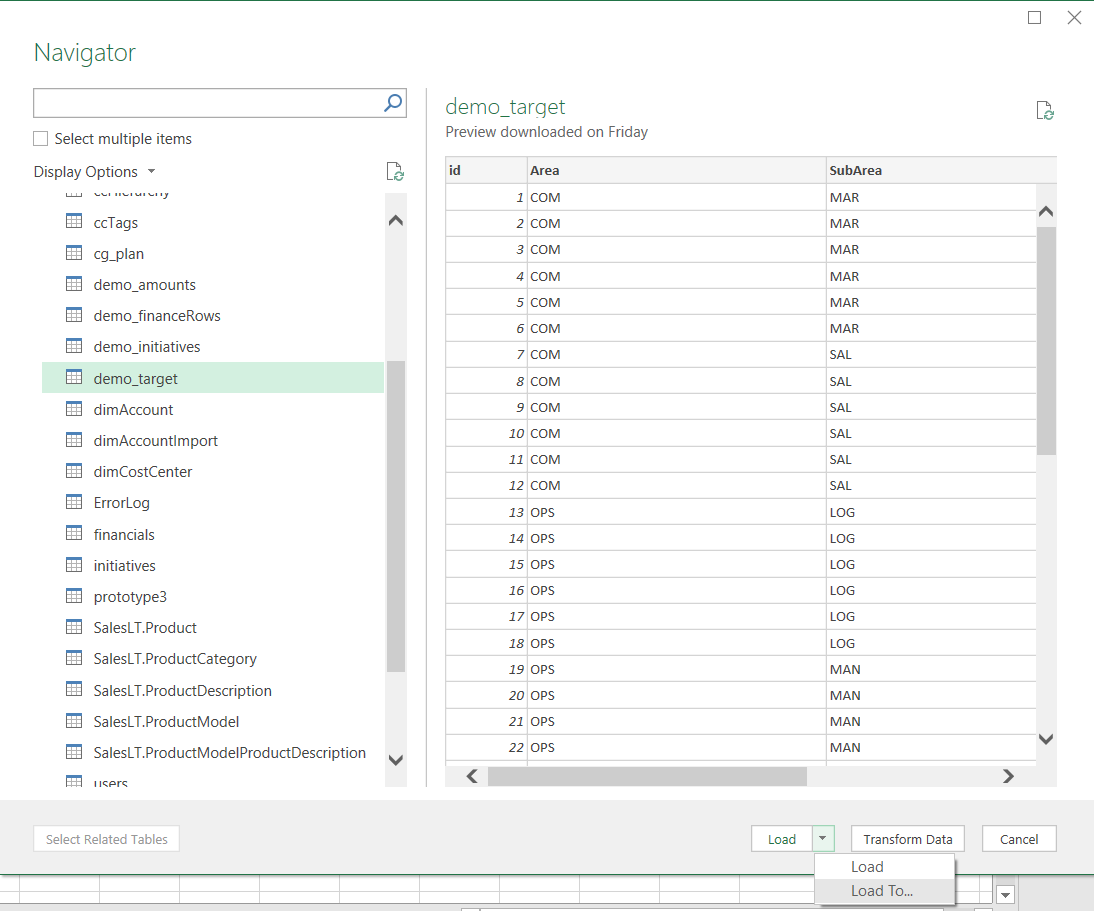
Then log on to your database and choose tables to load. Then click on ‘Load To…’
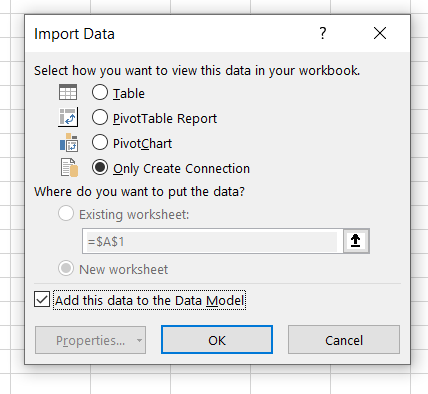
Then import to ‘Only Create Connection’. Avoid the other options as these would load the data straight into Excel, activating the row limit. Remember to tick the box to add this dara to the Data Model.
By retrieving data in either of these ways (they are fundamentally the same) you will be able to load millions of rows into the data model and then view this data in Excel using a pivot table.
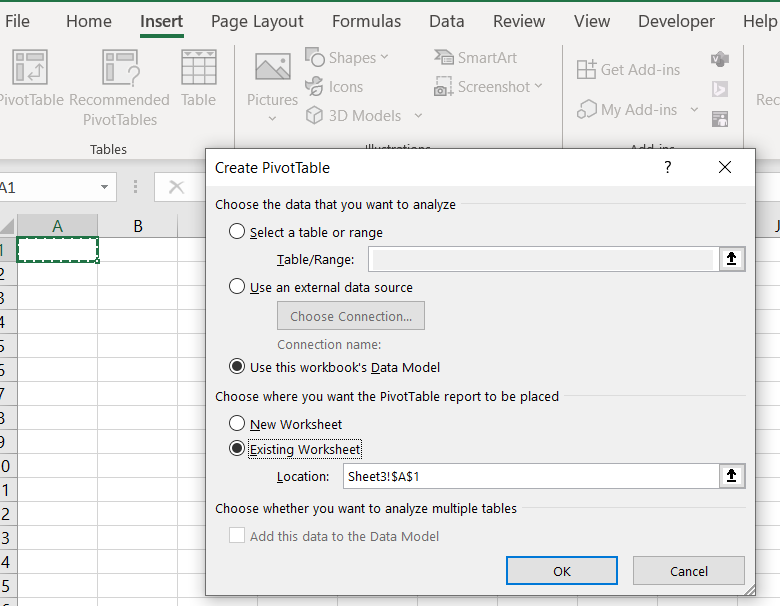
After the data is loaded, insert a pivot table anywhere in Excel and choose the data model as source:
Remember that the row limit will still apply when drawing up a pivot table, so don’t add all the fields to it at once.
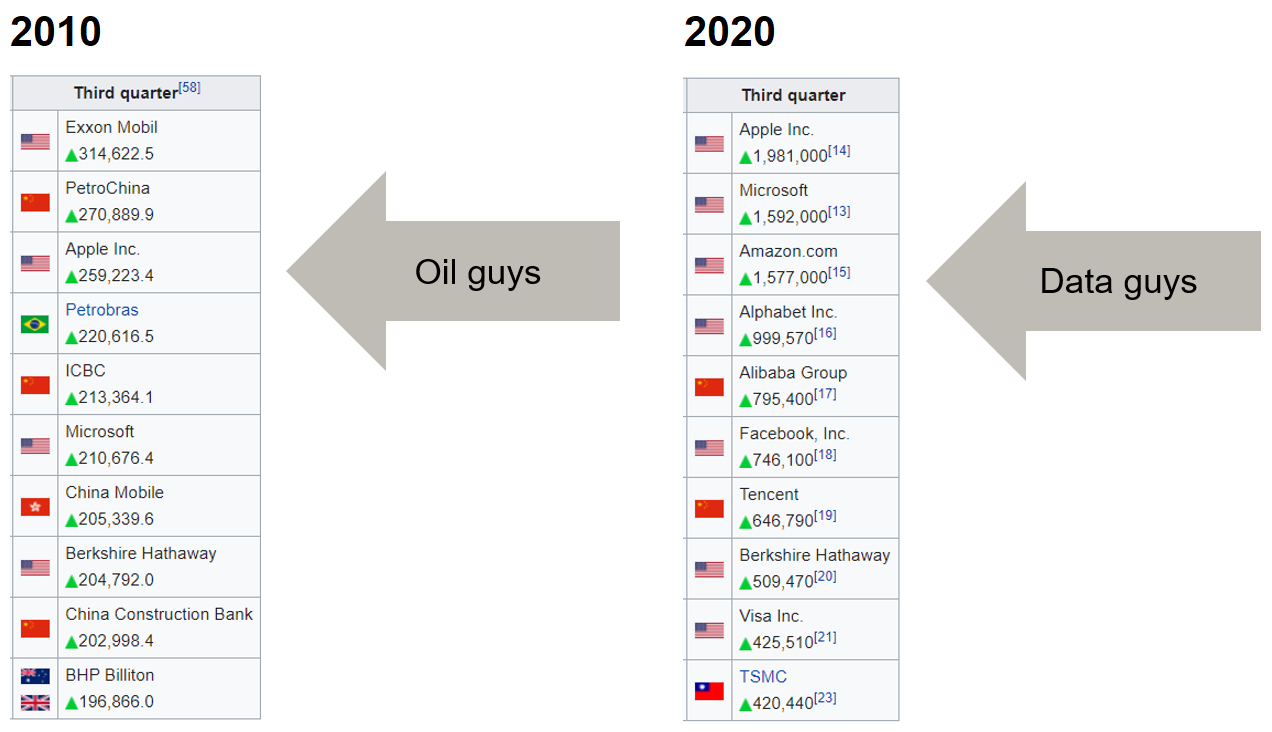
It’s fascinating how very quickly most of today’s tech giants have moved from start-up’s to world domination (see image below of largest market cap companies 2010 and 2020).
A few years ago the Economist published an article describing the similarities between this development and the growth of giant oil companies during the earlier part of the 20th century. The main topic of the article is how to ensure a competitive market. But it is interesting to note that this time the hot new commodity (data) is an abstraction created by humans, not a natural resource such as oil. Let’s hope that means resource scarcity will be less of a problem and that data can be a source of prosperity all over the world. In other words, you or your company probably have access to unique and valuable data. Try to make use of it.
Microsoft is continously adding new AI functionality to the Power Platform. Here is a brief look on how to use the text analytics function to detect the language and overall sentiment in a body of text.
This can be very useful when analysing interactions with customers or suppliers, the mood among team members and company perception among financial analysts or in the media.
This function is part of Azure Cognitive Services so you will need to create an Azure account to try this yourself.
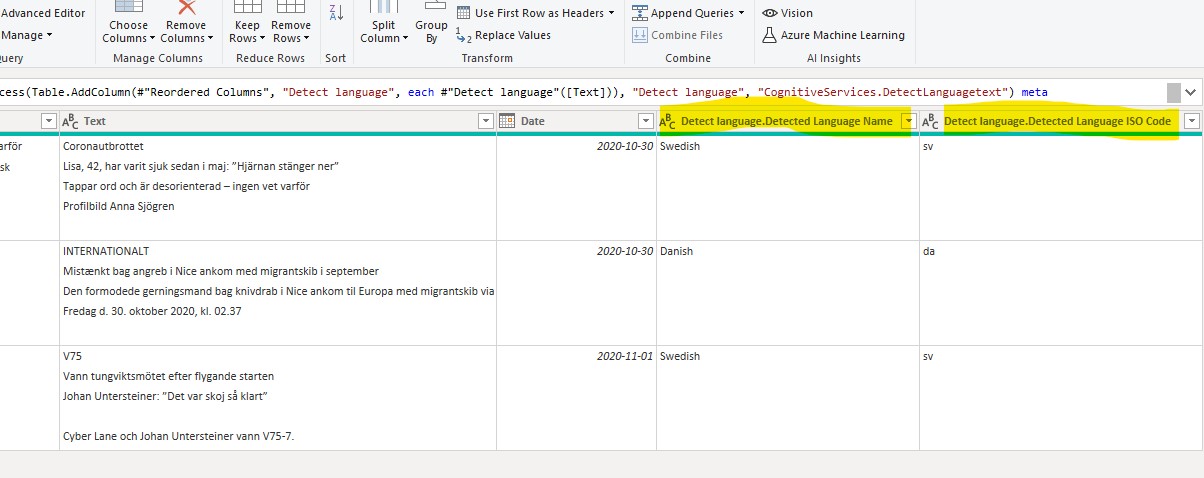
In the example below I am using a table with data about three newspaper articles. Two are in Swedish, one is in Danish. One of the Swedish articles is regarding a win in a horse racing event, the other is about the Coronavirus. The Danish article is about recent acts of terrorism in France.
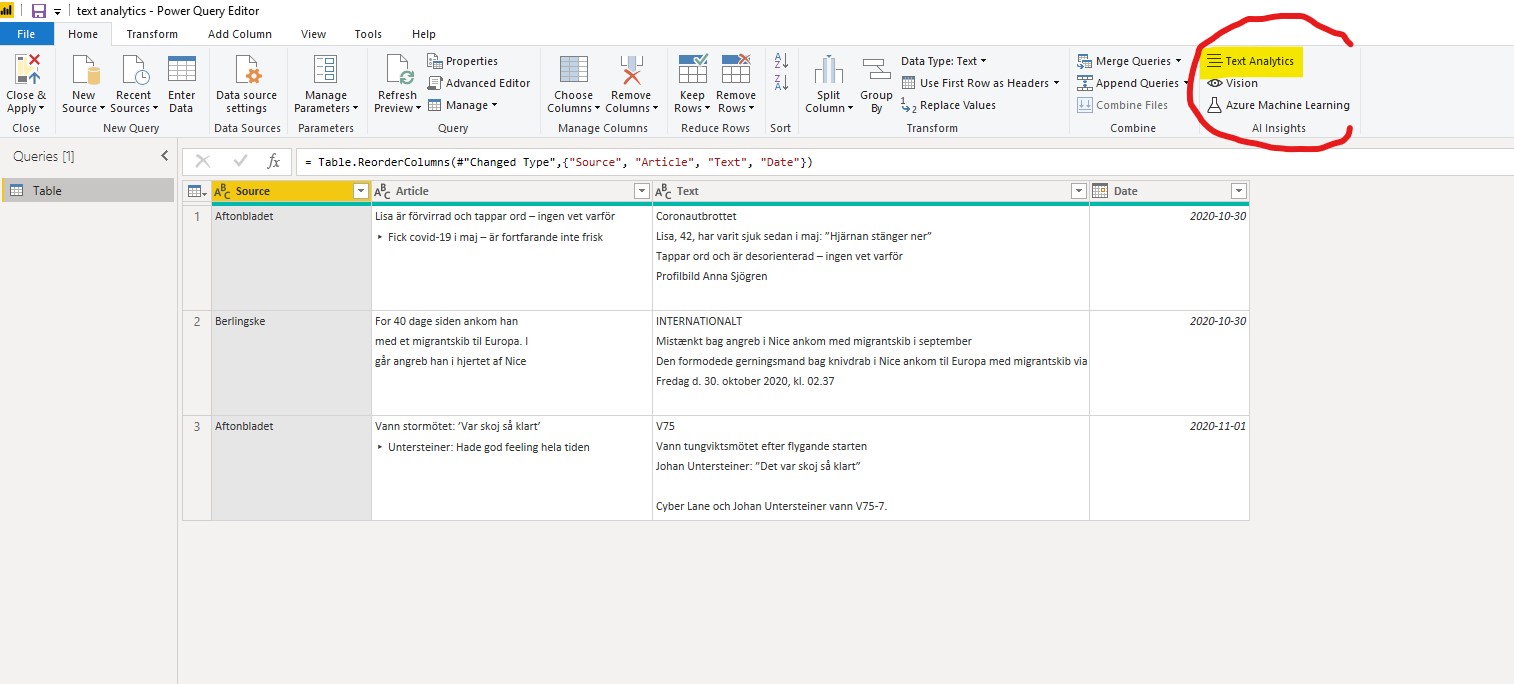
I have opened the Power Query Editor and marked out the ‘AI insights’ group under the Home tab. Today I am going to use the ‘Text Analytics” and the functions ‘Detect language’ and ‘Score sentiment’.
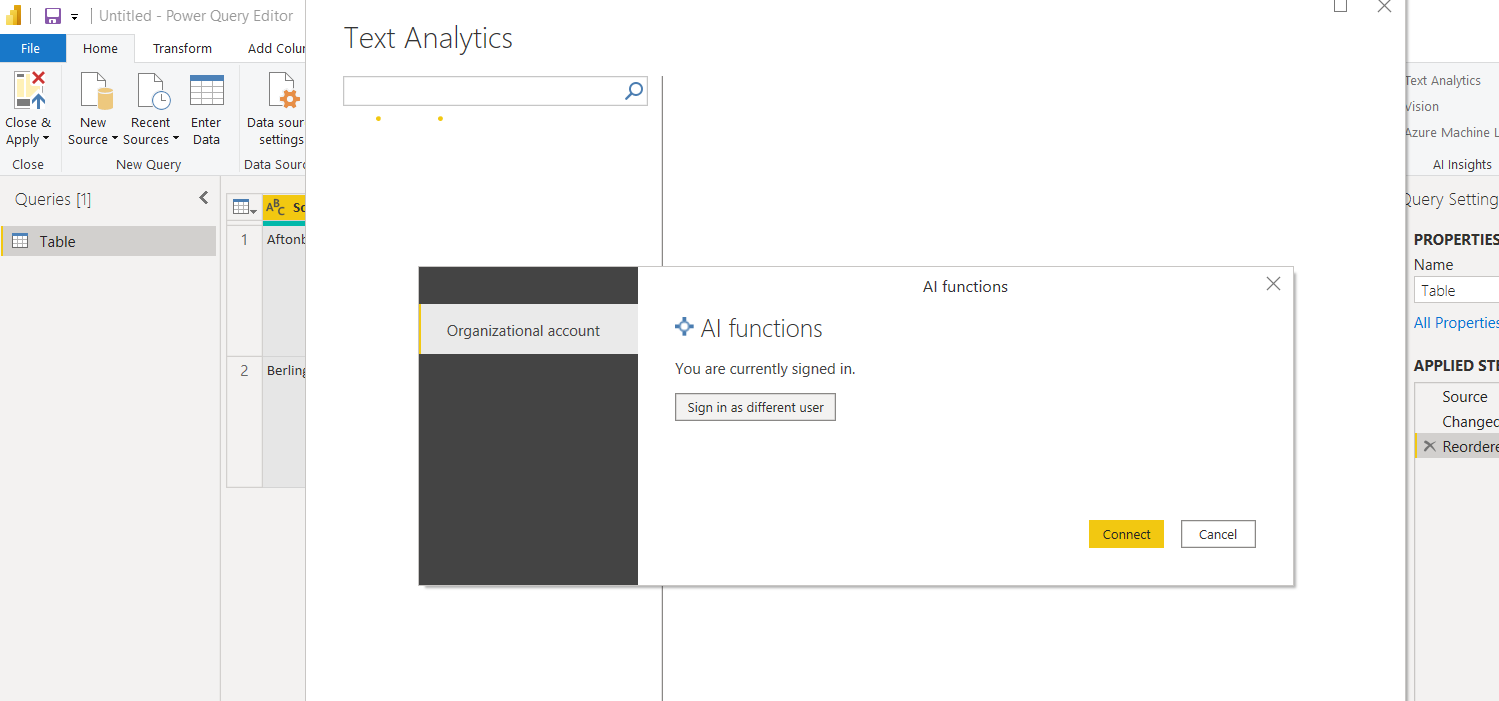
I am then prompted to sign in to my AI functions Azure account.
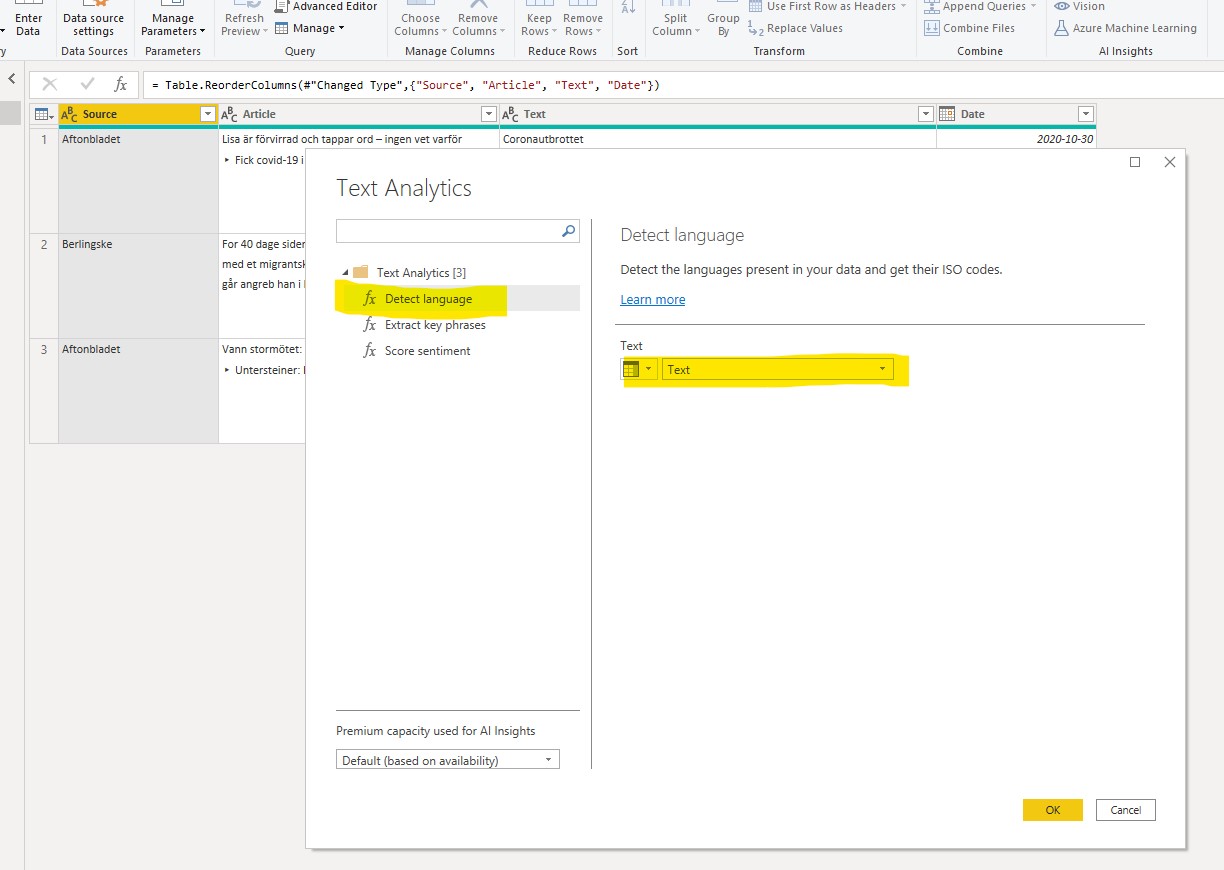
As the Score sentiment function is helped by pre-defining the language of a text, we will start with detect language. Simply select the column of the text you want do detect the language for.
After a brief moment (larger tables will take longer time) two new columns are returned. The first shows the detected language and the second the corresponding ISO code for that language code for that language (this column will be used next in the ‘Score sentiment’ function.
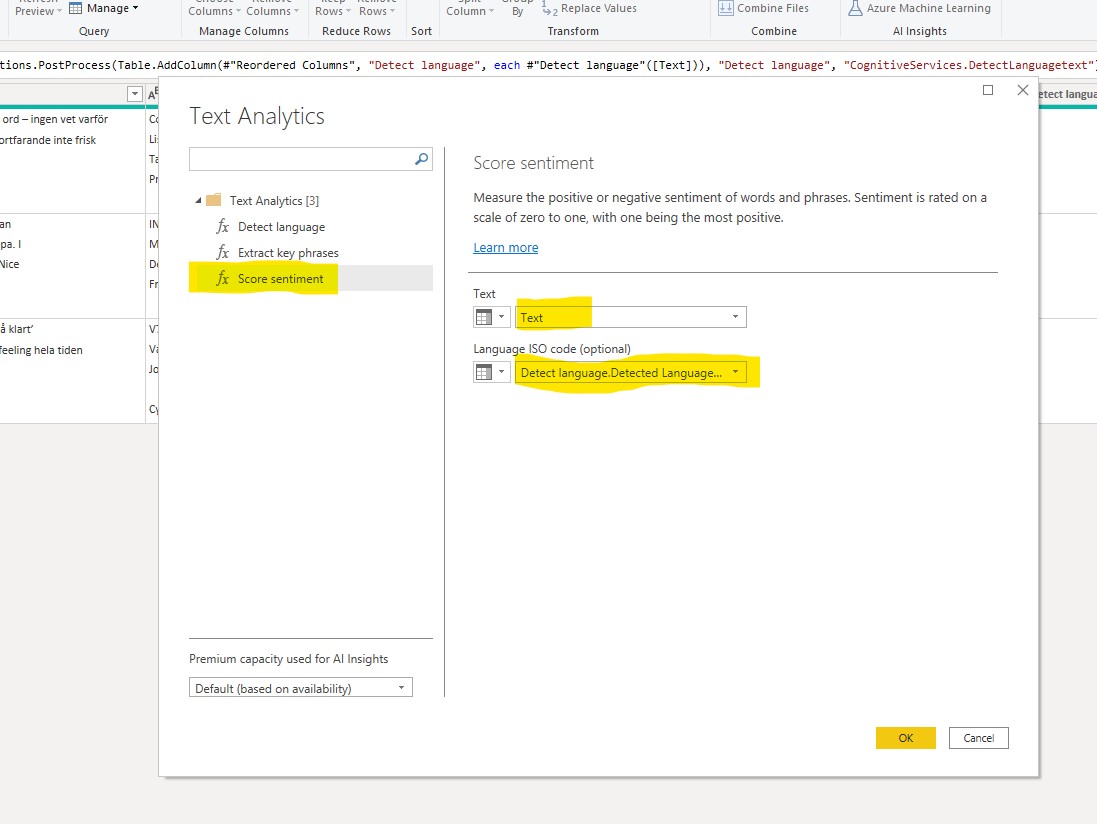
Now let’s try the ‘Score sentiment’ function. Choose the text column to analyse. As you can see there is an option to assist the model by providing a pre-defined language classification either as single two letter ISO code or as a column from the table. The second option is of course more useful if there are multiple languages in the table.
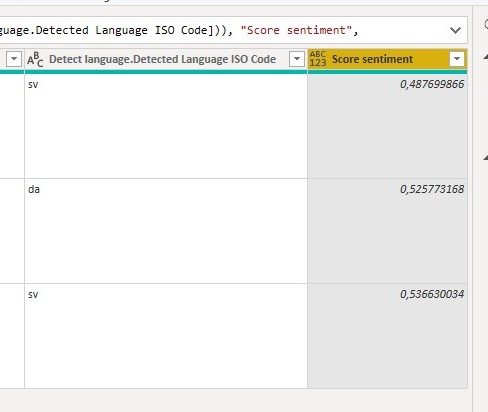
After pressing OK the function will return a new column with a score of the sentinment in respective texts. The score range is between 0 and 1, with 1 being the highest (most positive) sentiment. Usually most texts score between 0.4 and 0.6.
The results gave the article about horse racing the highest score (0.5366) and the article about the coronavirus the lowest score (0.4877).
Please note that the Danish article on terrorism is almost as high as the Swedish article on horse racing, whcih could seem counter-intuitive given the differing subject of the articles. I have also seen this pattern when using this function on other texts of different languages, where it seems different languages end up on their own language specific range, which differs from other languages. This it leads me to conclude that the function is not yet suited for comparison across different languages. However, it is very useful for comparison within languages and we can expect it will improve quickly over time.
For a detailed tutorial on the third text analytics function ‘Detect Key Phrases, check out this tutorial from Microsoft.
Finance professionals have operated digital tools for decades. Accounting and ERP systems were early applications in the digital era. But without the information in your organization, their data is nonsense. Therefore, tools like Excel and Powerpoint have become essential for gathering and presenting analysis of information.
This leaves your organization with scattered and unstructured data, unsuitable for the automated BI-reports you would like to roll out.
Traditional IT development is too expensive and generic to justify digitalization of smaller processes. But the progress within low-code application-makers, like Microsoft Power Apps has changed that.
Invisible Hand helps your organization design, implement and take ownership of your development pipeline.
A spectre is haunting business – the spectre of digitalization. All the old powers have gathered to profit from it: management consultants, IT behemoths, and bestselling futurist soothsayers alike wield the buzzword of the day to pierce their way into companies’ IT budgets. Where is the company that refuses to invent new jargon to push the promises of a new digital era, and instead delivers digitalized processes with existing tools, working as smooth as a Big Four pitch sounds.
Two things result from the current state of affairs:
Organizations want to reap the benefits that is being promised to them. The problems organizations want to address is to reduce internal and external transaction costs, i.e. allowing their business to focus on just that – the business – and not the needless inefficiencies that is a reality for companies today.
The gap between theoretical digitalization and its prophets, and the business’ reality is wide and widening. The snakeoil peddlers dream up new slideshows with little practical connection to the trenches. At the same time, highly effective, widely available, and tragically under-exploited weapons are readily available for the corporate soldiers. The wise leaders that employ these tools will get a more productive workforce that also serves vital business information to them on a digital, fully automated, and transparent silver platter.
To this end, the Invisible Hand have assembled to sketch the following manifesto. It outlines.
On the ladder of digital transformation, they flatter you by reckoning that you have taken the first necessary steps toward the digital avante garde, and their particular transformation journey/catch-all system/methodology will propel your organization above and beyond Silicon Valley. In the future everything is digital, they say (as they continue to pitch their monolith ERP system). By going down that trodden path, your organization adjust their digital capabilities to the technical specifications that comes out on the other end of a multi-million, year-and-a-half implementation project. It is the lowest common denominator functionalities that The Leviathan IT Company thought you, and a hundred other businesses bearing no similarities to yours, might find useful.
After some training, your talented and excited workforce gets a good grip on how to perform their old tasks in the new environment. Some feel recognized because the organization has invested in a glossy interface for them. Some find it easier to perform previously time-consuming tasks. Many will say, “wouldn’t it be nice if we could do [insert brilliant idea] as well”, and at best be told that the Leviathan engineers might look into that in the future. No one has been given the tools to explore these ideas themselves. No one has been digitally transformed. As the new system’s lifecycle rapidly closes in on a new multi-million upgrade, the excitement morphs into envy of some other department’s seemingly cooler IT tools and frustration of those long-forgotten specification requests.
In the middle ages, religious acolytes and feudal warlords had monopolized the written word. The immortalization of ideas – a revolutionary invention enabled by pragmatic Middle-Eastern accountants in the dawn of civilization – had been bastardized as propaganda and delusion. But things evolved. Replication costs plummeted with the printing press, and the We, the people, demanded access to education. The pedestals of the litterate class finally became crowded, and prosperity ensued. Similarly, the codification of processes were invented by brave academics and engineers in the 20th century. At the advent of the digital age, the new litterate class of IT professionals entrench their positions, not with brute force, but with impenetrable jargon and perpetually increasing air of complexity in the upcoming theoretical concepts. Nonetheless We, the people, are kept at arms lenght from the tools that can propel us to never before experienced levels of wealth and wellbeing.
The deep moat of code litteracy has given rise to a new societal function: the pseudo-litterate consultant that bridge the moat: a fragile bridge of vague understanding of both your real problems and the jargon. This highly specialized creature has evolved to first create an urge in your organization to embark on a digitalization journey. Then, it can freely charge you for running back-and-forth with liberally interpreted messages in languages it does not fully master. The digital age has lowered informational transaction costs immensely, but transactional costs in creating sound processes for capturing said information has risen at the same pace as the interpretor-consultants’ bank account.
Our epoch, the epoch of digital promises, deserves something better. It is time for us to arm ourselves with tools tailored for our specific circumstances and requirements. It is time for us to be empowered to customize and add to these tools as our circumstances change. It is time to yet again crowd the pedestals of the litterate class, and tear down their monopoly of information creation. And it is time to rid ourselves of the yoke of expensive misinterpretators of our problems. Wield your no-code pitchforks, and take control of your own digitalization adventure.